

Comparative DNA Analysis of the Asian Elephant Populations
by Régis Debruyne - Muséum National d'Histoire Naturelle, Paris - 2003

Though lying at the interface of many thematics of research (of which ecology, ethology, conservation biology and evolution can be cited), Asian elephants and their history remain mysterious. The first genetic analyses of their DNA sequences are recent (Fernando et al. 2000; Hartl et al. 1996) and left many questions unsolved. It is still unclear if the partitioning of populations due to forest fragmentation since the past centuries had notable effects on the genetic richness and diversity of the species. In certain parts of their historical range, elephant populations have dramatically declined in numbers, and it has now become an urgent matter to evaluate the impact of the action of Man.
Here are the preliminary results of the analysis of two mitochondrial markers with the most comprehensive sample to date of Asian elephants from Arunachal Pradesh and Northern Myanmar region.
SAMPLES
The lack of genetic data concerning Asian elephants is related to the difficulty to collect many samples from wild animals in order to perform DNA analyses. Indeed, wild elephants are extremely cautious and invasive methods of sampling (like biopsy darts) are now prohibited for this species classified as "threatened" (Sukumar, 1989). Among non-invasive sampling methods, fresh dung piles can be used as a source of DNA (Fernando et al. 2000). However, this method has one major drawback that is a possible bias introduced if ever several dungs of the same animals are sampled. For that reason, we took advantage of samples of hair provided by Aane Mane Foundation. They had been sampled on tamed animals among which we focused on wild born elephants. To be valid, these hair had to be sampled with their bulb which contains the major part of the DNA. For technical convenience, hair were air-dried and stored at ambient temperature up to several months and no degradation of their DNA content was noticed. Thus this sampling method should be considered as extremely practical. Actually, 15 elephants from north-Myanmar, 10 elephants from Arunachal-Pradesh and 10 other ones from Karnataka were considered. They were compared to our database of DNA sequences from captive Asian elephants from different zoos and reserves (Debruyne et al. in prep.): a data set of 55 Asian elephants was finally constituted. Four African elephants (Loxodonta africana) were used to root the phylogenetical tree of Elephas maximus.
CHOICE OF MOLECULAR MARKERS
Genetic diversity has been shown to be limited within Asian elephants. Thus, we chose fast evolving genes to assess phylogenetical relationships in this lineage: the N-terminal fragment (400 nucleotides) of the cytochrome b and the Hypervariable Region 1 (405 nucleotides) of the control region were used. Cytochrome b and control region genes are both mitochondrial markers whose transmission is maternal only.
TREATMENT AND ANALYSIS
We used a routine protocol of extraction with CTAB digestion for every body hair. Extracts were purified with Chloroform/iso-amyl-alcohol. They were finally stored at -20°C. PCR amplification used specifically-designed primers (Debruyne et al. in prep.). This phase produces a selective exponential multiplication of the fragments of interest to be sequenced. Once amplified, products were submitted to manual sequencing.
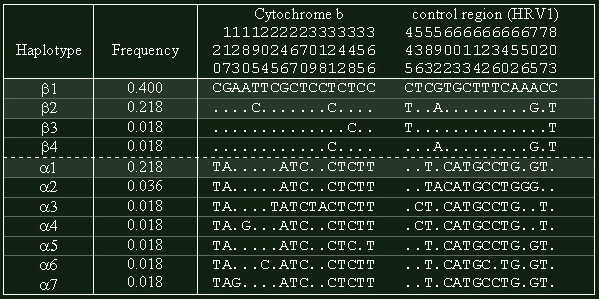
DNA sequences obtained were aligned and edited with MUST package (Philippe, 1993). Data will soon be available on Genbank database (Debruyne et al. in prep.). In our analyses, nucleotides sequences of cytochrome b were numbered 1-400, and those of control region 401-805 (fig.1). Phylogenetic trees were constructed using maximum parsimony procedure with the program PAUP* (Swofford, 1998).
RESULTS
We retrieve a low level of genetic variation within asian elephants: only 33 nucleotides were found to be polymorphic and 28 were parsimony-informative characters (for a total of 805). It represents only 40% of the total variability between Asian and African elephants. Eleven haplotypes (that is to say different types of sequences) were identified (fig.1). Haplotype frequency values ranged from 0.400 for the most frequent haplotype (Haplotype β1), to 0.018 for 7 haplotypes that had single occurrence. Actually, only 3 haplotypes (β1, β2 and α1, in grey on fig.1) represent more than 80% of our sample.

Figure 1: display of polymorphic nucleotides between the different haplotypes found among Asian elephants. A period corresponds to a matching nucleotide with the top-most sequence. The position of the nucleotides is displayed vertically.
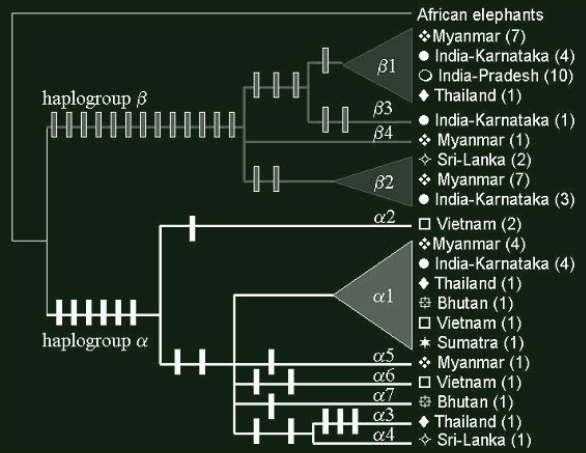
At a phylogenetical level, we show that these haplotypes segregate in two distinct assemblages (or haplogroups). These haplogroups, called α and β (fig.2), had already been found by Fernando et al. (2000) with similar data obtained for a wide sample of elephants (but with no data from Myanmar). A deep discontinuity is thus observed within Asian elephants.
Concerning population structure, it is notable that the greatest samples of India and Myanmar reveal that these countries share both haplogroups α and β. However, as far as Arunachal-Pradesh is concerned, a thorough genetic identity is observed between the 10 samples available (fig.2). For countries with reduced samples, the situation remains unclear: Thailand and Sri-Lanka are composed of animals from both haplogroups, whereas Vietnam and Bhutan are monotypic. More comprehensive samples are necessary to reach an undoubtable conclusion for the populations of these countries.

Figure 2: Most parsimonious tree (Length=43 ; CI=0.79 ; RI=0.90). Haplogroup α is in black while haplogroup β is in grey. Vertical bars are each a mutational step on the branches leading to different haplotypes (with ACCTRAN optimization of character states). Geographical origin and number of specimens (in brackets) are indicated for every branch of the tree.
In all cases, these results denote a very low genetic subdivision of Asian elephants. Local populations, like elephants from Karnataka, may show an inner diversity as important as the one that can be found throughout Asia. All Asian elephants share the same global polymorphism wherever they might come from: continental areas and even Sri-Lanka are mostly represented by individuals of haplotypes β1 & β2 on one hand and α1 on the other hand. Unfortunately, samples size is too reduced to estimate reliable frequencies of haplotypes in any of the tested areas. Furthermore, other haplotypes are rare and might correspond to recent local differentiation.
DISCUSSION
The recognized classification within Asian elephants rests on main geographic subdivisions of the extant range of Asian elephants: Elephas maximus indicus are to be found on continental areas while Elephas maximus maximus occupy the island of Sri-Lanka and Elephas maximus sumatranus the island of Sumatra. Even if limited, our data demonstrate that insular elephants share at least two of the most spread continental haplotypes. Thus, separate subspecies designation is regarded as artificial partitioning of recently separated genetic pools: this division may have originated during the successive phases of Pleistocene marine transgression, and it is to recent to have enabled the establishment of deep genetic nor morphological division.
The Asian elephants cluster in two well-differentiated assemblages. These haplogroups neither fit the systematic frame nor correspond to extant geographic division of the animals. That is to say that one elephant from Myanmar and one another from Karnataka might be more closely related than any couple of elephants from Myanmar or Karnataka. We then shed light on a deep historical partitioning of elephants populations. This partitioning may have been due to ancient division of their geographic range, but no evidence of such a barrier can be found nowadays. A definitve conclusion awaits a broader analysis.
The β haplogroup seems to be much more divergent from ancestral state than is the α haplogroup (fig.2). It is likely that this extreme divergence is artificial: some dramatic demographic events can accelerate molecular evolution of lineages.
It appears that, for geographic range where Asian elephants are still numerous (Karnataka, ?, for example), a good haplotype diversity is maintained: 4 animals display haplotype β1, 4 others the haplotype α1, 3 others the haplotype β2, and the last one the haplotype β3. On the contrary, areas where demography declined dramatically are genetically poor: Arunachal-Pradesh specimens only display β1 haplotype. The reduction of population size is related to the loss of haplotypes, especially rare ones, and to the increase of inbreeding.
Conclusion
This study aimed at discovering whether fragmentation of forest habitat of elephants and poaching of the last decades had had measurable effects on the genetic diversity of populations of Asian elephants. Two scales are examined: the local scale of population and the global scale of continental relationships between populations.
Concerning the inner diversity, it is clear that reduction of size of populations has critical effects with a reduction of haplotypes richness due to genetic drift.
As for the global diversity among Asian elephants, our results rather show that historical pattern of differentiation is maintained. This pattern is the product of ancient events that predated human actions. No other genetic subdivison has been observed. The same polymorphism is thus to be found throughout the extant range of elephants.
As a consequence, massive or individual transplantations of elephants from greatest populations to most threatened regions can be envisaged without attempting to the genetic integrity of populations. On the contrary, such an approach of the conservation of Elephas maximus may enable to reduce the effects of the recent partitioning of elephants' habitat: inbreeding within populations and molecular divergence between populations will otherwise lead to an accelerated degradation of the genetic potential of this still endangered species.
References
Fernando, P., Pfrender M.E., Encalada, S.E. & Lande, R. 2000. Mitochondrial DANN variation, phylogeography and populations structure of the Asian elephant. Heredity 84: 362-372.
Hartl, G.B., Kurt, F., Tiedemann, R., Gmeiner, C., Nadlinger, K., U-Mar, K. et al. 1996. Populations genetics and systematics of Asian elephant (Elephas maximus): a study based on sequence variation at the Cyt b gene of PCR-amplified mitochondrial DNA from hair bulbs. Zeitschrift für Saugetierkunde, Int. J. Mam. Biol. 61: 285-294.
Philippe, H. 1993. MUST, a computer package of Management Utilities for Sequences and Trees. Nucl. Acids. Res. 21: 5264-5272.
Shoshani, J. & Eisenberg, J.F. 1982. Elephas maximus. Mammalian Species 182:1-8.
Sukumar, R. 1989. The Asian elephant: ecology and management. Cambridge University Press, Cambridge, UK.
Swofford, D. 1998. PAUP*: Phylogenetic Analysis using parsimony, version 4.0.0d64. Smithsonian Institution, Laboratory of Molecular Systematics, MSC, MRC-534, 20560, Washington D.C.
© Copyright 2008-2025 Aane Mane Foundation.
Tous droits réservés. Site créé par Lor.